Introduction
Lately, I’m researching swift source-based code coverage solutions for my company’s projects. I’ve tried lot effort and find out the good practice for it.
In this short post, I will introduce to you:
- How to generate *.profraw file and measure the code coverage data by command line.
- How to call the C/C++ method in Swift App project.
- How to measure the code coverage for complete Swift App Project in Xcode.
Practice with Command Line
Before we measure the code coverage for complete App Project, we could create a simple Swift source code file and generate *.profraw with command line, in order to learn the basic workflow for generating coverage profile.
Create a swift file with code below.
test()print("hello")func test() {print("test")}func add(_ x: Double, _ y: Double) -> Double {return x + y}test()
Run command line below in Terminal.
swiftc -profile-generate -profile-coverage-mapping hello.swiftThe options, -profile-generate and -profile-coverage-mapping, pass to compiler will enable coverage when compiling source code. Source-based code coverage feature operates on AST and preprocessor information directly.
Then run the binary output file.
./helloAfter running the binary file, ls current direction, we will find that there has been generated a new file named default.profraw. This file was generated by llvm. In order to measure the code coverage, we must use another tool llvm-profdata to combine multiple raw profiles and index them at the same time.
xcrun llvm-profdata merge -sparse default.profraw -o hello.profdataRun the command line above in terminal, we will get a new file named hello.profdata, which could show the coverage report we want. We can use llvm-cov to show or generate a JSON report.
xcrun llvm-cov show ./hello -instr-profile=hello.profdata
xcrun llvm-cov export ./hello -instr-profile=hello.profdata
Now, we have already known the basic workflow to generate swift code coverage report. It seems that source-based code coverage for Swift is not so difficult. However, the configuration for complete Swift App Project in Xcode is quite difference with command line. Let me show you then.
Measure Code Coverage for Swift App Project in Xcode
Create Swift Project.

Select SwiftCovApp target -> Build Settings -> Swift Compiler — Custom Flags. Add -profile-generate and -profile-coverage-mapping options in Other Swift Flags.

If we build and run the project immediately, It will report an error bellow.
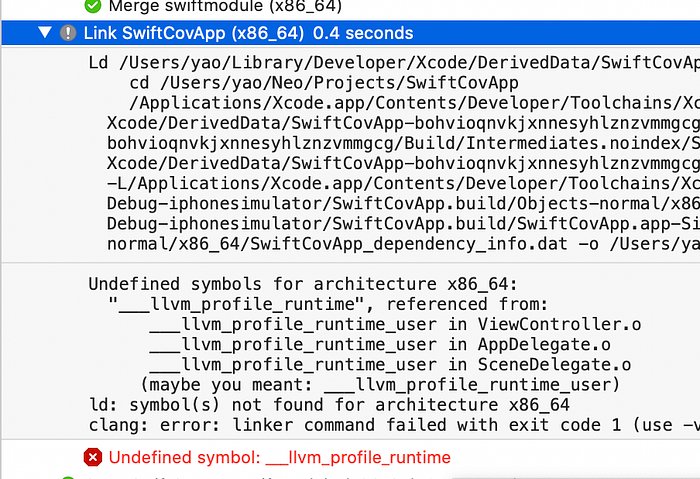
To solve this problem, we must enable Code Coverage for all targets.
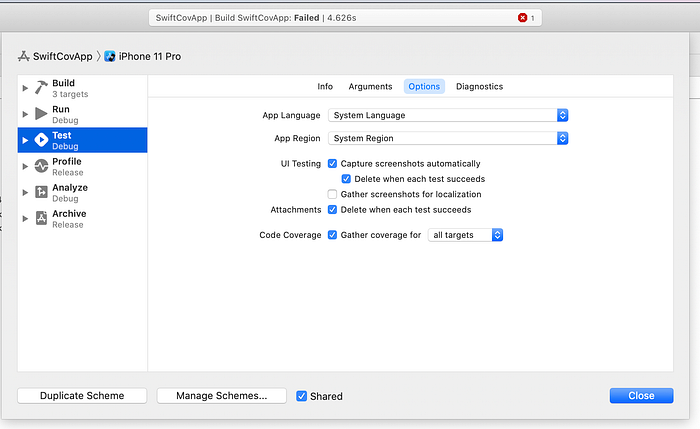
Run the project again after enabling Code Coverage, the project will Build Success and Launch in Simulator.
We have learnt that when the program exits compiler will write a raw profile to the path specified by the LLVM_PROFILE_FILE environment variable. So we should kill the process of the Application to achieve the *profraw file. However, when we end the App, it reports an error in console.
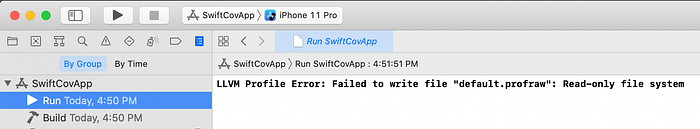
Though I have set the same configuration in Build Settings, the default environment path in Xcode is empty. To solve the problem, we must create a new header file and declare some llvm C api functions for Swift to call.
Call C/C++ methods in Swift
Swift is a powerful language based on C/C++, it can call C/C++ methods directly. However, before we call the llvm C/C++ api, we must export the methods we need as a module.
Create a new Header file.
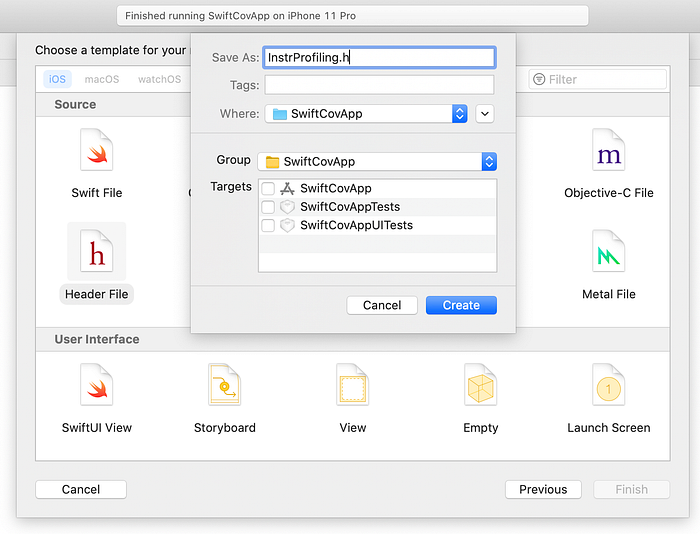
Copy and paste the code into InstrProfiling.h
#ifndef PROFILE_INSTRPROFILING_H_
#define PROFILE_INSTRPROFILING_H_int __llvm_profile_runtime = 0;void __llvm_profile_initialize_file(void);
const char *__llvm_profile_get_filename();
void __llvm_profile_set_filename(const char *);
int __llvm_profile_write_file();
int __llvm_profile_register_write_file_atexit(void);
const char *__llvm_profile_get_path_prefix();#endif /* PROFILE_INSTRPROFILING_H_ */
Create a module.modulemap file and export all as a module.
//
//  module.modulemap
//
//  Created by yao on 2020/10/15.
//module InstrProfiling {
    header "InstrProfiling.h"
    export *
}
Actually, I cannot create a module.modulemap file directly. I create a module.c first and rename it to module.modulemap. And it can also help me create a SwiftCovApp-Bridging-Header file.
Build the project, and then, we can call llvm apis in Swift source code.
import UIKitimport InstrProfilingclass ViewController: UIViewController {override func viewDidLoad() {super.viewDidLoad()// Do any additional setup after loading the view.print("File Path Prefix: \(String(cString: __llvm_profile_get_path_prefix()) )")print("File Name: \(String(cString: __llvm_profile_get_filename()) )")let name = "test.profraw"let fileManager = FileManager.defaultdo {let documentDirectory = try fileManager.url(for: .documentDirectory, in: .userDomainMask, appropriateFor:nil, create:false)let filePath: NSString = documentDirectory.appendingPathComponent(name).path as NSString__llvm_profile_set_filename(filePath.utf8String)print("File Name: \(String(cString: __llvm_profile_get_filename()))")__llvm_profile_write_file()} catch {print(error)}}}
Build and launch App, we’ll see the raw profile path in the console.
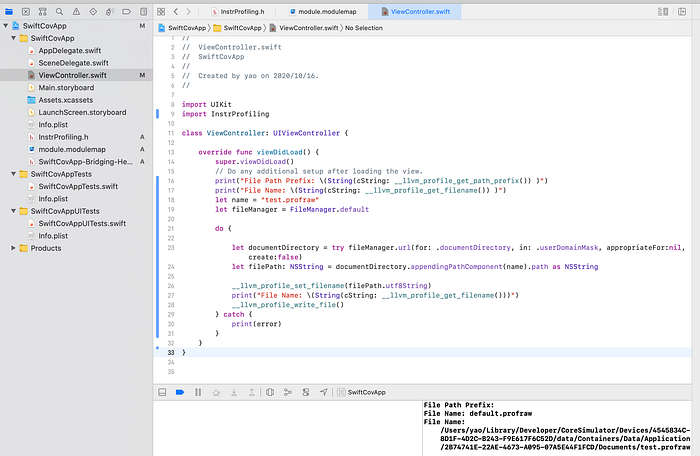
Finally, we get the raw profile we need! 🎉
We could copy this file and the Mach-O (binary file) in Products of Swift App Projects into a temp directory, so that we could check whether the profile could generate a correct report or not.
Create a new Swift source code.
import Foundationstruct BasicMath {static func add(_ a: Double, _ b: Double) -> Double {return a + b}var x: Double = 0var y: Double = 0func sqrt(_ x: Double, _ min: Double, _ max: Double) -> Double {let q = 1e-10let mid = (max + min) / 2.0if fabs(mid * mid - x) > q {if mid * mid < x {return sqrt(x, mid, max)} else if mid * mid > x {return sqrt(x, min, mid)} else {return mid}}return mid}func sqrt(_ x: Double) -> Double {sqrt(x, 0, x)}}
And call the sqrt before __llvm_profile_write_file in ViewController.swift . Then, build and run.
print("√2=\(BasicMath().sqrt(2))")__llvm_profile_write_file()
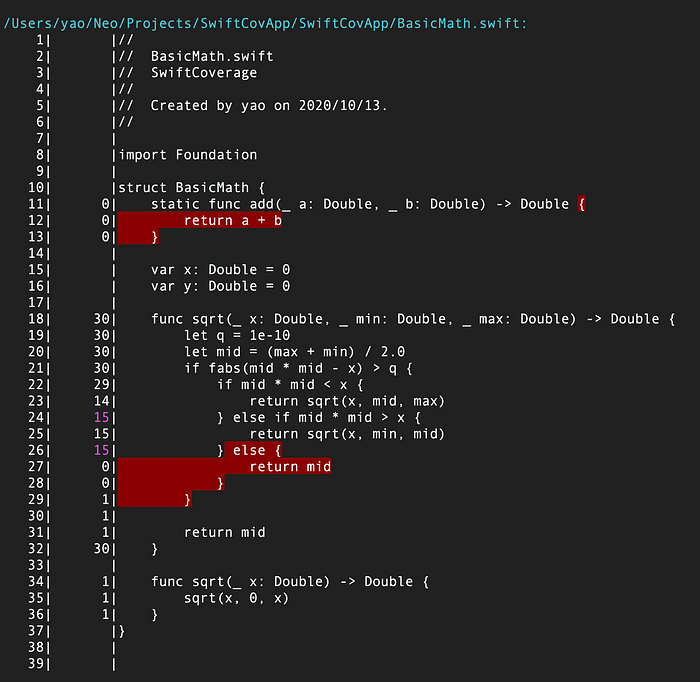
Run the command line below.
mkdir TestCoveragecd TestCoveragecp /Users/yao/Library/Developer/CoreSimulator/Devices/4545834C-8D1F-4D2C-B243-F9E617F6C52D/data/Containers/Data/Application/6AEFAB1B-DA52-4FAF-9B27-3D47A898E55C/Documents/test.profraw .cp /Users/yao/Library/Developer/Xcode/DerivedData/SwiftCovApp-bohvioqnvkjxnnesyhlznzvmmgcg/Build/Products/Debug-iphonesimulator/SwiftCovApp.app/SwiftCovApp .lsxcrun llvm-profdata merge -sparse test.profraw -o test.profdataxcrun llvm-cov show ./SwiftCovApp -instr-profile=test.profdata
And we’ll see the finally report~👏🎉
Reference
- Clang 12 Documentation — https://clang.llvm.org/docs/SourceBasedCodeCoverage.html
- Objective-C 与 Swift 混编工程精准测试探索 — https://mp.weixin.qq.com/s/14hmLWNXAh1FKZT5NI5QsQ
